The advocacy on the Port Authority of NY&NJ to widen the George Washington Bridge paths is entirely consistent with guidance and regulations put forth by multiple federal transportation agencies.
AASHTO
The American Association of State Highway and Transportation Officials (“AASHTO”) 2012 Guide for Development of Bicycle Facilities guidelines have been broadly accepted as “best practices” by DOTs across the U.S. Adherence insulates the transportation provider from liability arising resulting from crashes involving bicyclists.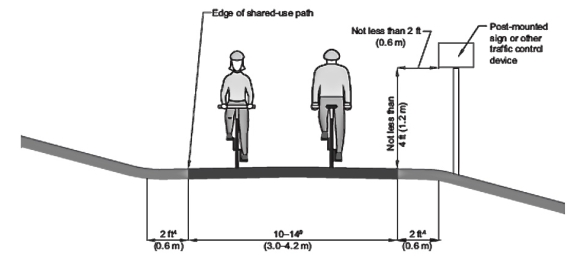 The AASHTO guide states that the minimum paved width for a two-directional shared use path is 10 foot. In addition, widths of 11 to 14 foot widths are advised:
- Where peak user volumes are expected to exceed 300 total users hour;
- To serve a high percentage (30%) of pedestrians;
- Or skaters, adult tricycles, children or other users that need more width;
- If it will be used by larger maintenance vehicles;
- On steep grades to provide additional passing area;
- And, through curves to provide more operating space.
11 to 14 foot has been found sufficient for two directional paths plus a shared passing lane. 15 foot would support two (2) paths plus two (2) passing lanes.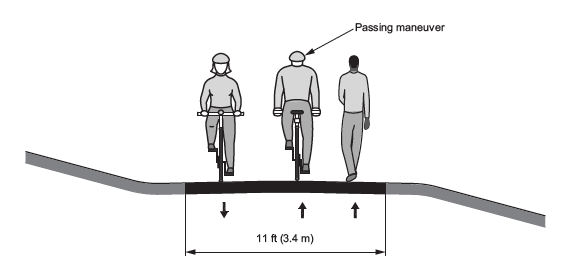
In very rare circumstances, a 8 foot may be used:
- Where bicycle traffic is expected to be low, even on peak days or during peak hours
- Pedestrian use of the facility is not expected to be more than occasional
- For a short distance due to a physical constraint such as a bridge abutment, utility structure, etc.
- With warning signs to indicate the pathway narrows at these locations.
Resource: 2012 AASHTO Guide for Development of Bicycle Facilities, http://tinyurl.com/y943er3j
Notes: Weekend peak hour GWB trips in 2014-2015 averaged 517 users per hour, with pedestrians comprising 25% of total. The current and PA’s proposed width of the GWB path is 7 foot.
FHWA
The Shared Use Path Level of Service Calculator (“SUPLOS”) is a tool to help determine the appropriate width of a pathway given existing or anticipated user volumes and mixes. It was developed to work in conjunction with the AASHTO Bike Guide.
SUPLOS Variables
- path width
- total number of peak hour users
- composition – cyclists, pedestrians, runners … child bicyclists, roller bladers, etc.
- center dividing line
SUPLOS Grading
The SUPLOS model uses six levels of service categories and the letters A to F are used to represent them, from best to worst. Maintaining an optimum speed (for the bicyclist) is a key criterion. Service measures are primarily related to freedom to maneuver. These include meetings, active passes, delayed passes, and the perceived ability to pass.
A >4.0/Excellent. Trail has optimum conditions for bicyclists and retains ample space to absorb more users of all modes, while providing a high–quality user experience. Some newly built trails will provide grade–A service until they have been discovered or until ridership builds up to projected levels.
B 3.5-4.0/Good. Trail has good bicycling conditions, and retains significant room to absorb more users, while maintaining an ability to provide a high–quality user experience.
C 3.0-3.5/Fair. Trail has at least minimum width to meet current demand and to provide basic service to bicyclists. A modest level of additional capacity is available for bicyclists and skaters; however more pedestrians, runners, or other slow–moving users will begin to diminish LOS for bicyclists.
D 2.5-3.0/Poor. Trail is nearing its functional capacity given its width, volume, and mode split. Peak–period travel speeds are likely to be reduced by levels of crowding. The addition of more users of any mode will result in significant service degradation. Some bicyclists and skaters are likely to adjust their experience expectations or to avoid peak–period use.
E 2.0-3.5/Very Poor. Given trail width, volume, and user mix, the trail has reached its functional capacity. Peak–period travel speeds are likely to be reduced by levels of crowding. The trail may enjoy strong community support because of its high usage rate; however, many bicyclists and skaters are likely to adjust their experience expectations, or to avoid peak–period use.
F <2.0/Failing. Trail significantly diminishes the experience for at least one, and most likely for all user groups. It does not effectively serve most bicyclists; significant user conflicts should be expected.
Resources: Shared Use Path Level of Service (“SUPLOS”) Calculator User’s Guide, http://tinyurl.com/mzuyhxe, SUPLOS Calculator Excel spreadsheet (live), https://tinyurl.com/yms8nsbd
NYCDOT GWB Traffic Counts
 NYC DOT hourly peak use. Does not include 25% ped-runners.
 NYC DOT daily peak use. Does not include 25% ped-runners.
GWB peak use on the is weekends vs. weekdays for East River bridges. GWB growth of 10.4% for 2010-2015 compares to 12.5% for NYC overall for same period.
While it took the expansion of NYC’s bike grid to 1000 miles, and implementation of bike share, to propel that growth, the GWB’s increase has been in spite of its “F” grading.
SUPLOS grading of current and proposed GWB path configurations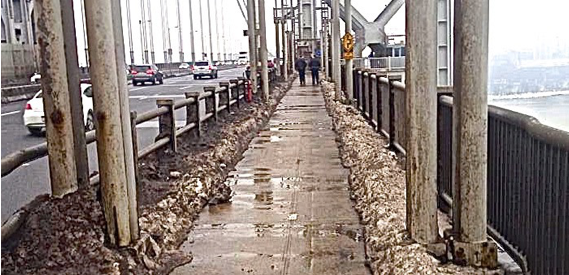 Current GWB. (1) 7′ path for peds, runners, cyclists. Photo by Hassan Diop
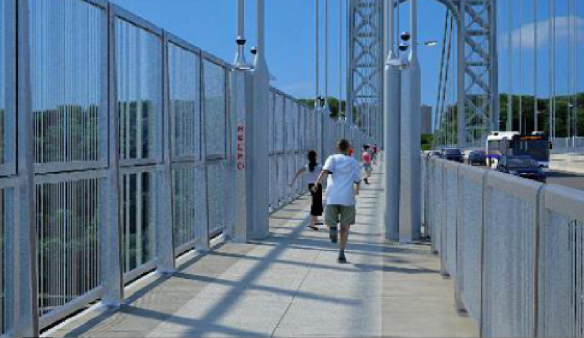 Port Authority’s Plan: (1) 7′ path for peds-runners. (1) 7′ path for cyclists. 11′ high anti-suicide barrier. Rendering by Amman & Whitney.
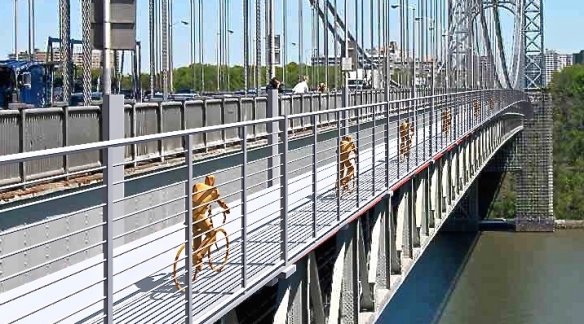 Complete George: (2) 10′ paths for cyclists plus (2) 7′ paths for peds-runners. 9′ high anti-suicide barrier. Rendering by Joseph Lertola.
USDOT
USDOT encourages states, local governments and transportation agencies to:
- Consider walking and bicycling equal to other transportation modes and not an afterthought in roadway design.
- Integrate bicycle and pedestrian accommodation during maintenance projects, and on new and rehabilitated bridges up to 20% of the cost of the larger project.
- Go beyond minimum design standards. It is more effective to plan for increased usage than to retrofit an older facility.
- Collect data on walking and biking trips. Set mode share targets and track them over time.
Resources: Policy Statement on Bicycle and Pedestrian Accommodations, http://tinyurl.com/yccn8qmo, Accommodating Bicycle-Pedestrian Travel: A Recommended Approach, http://tinyurl.com/ya8wmpxe
National Cooperative Highway Research
A study of 20 state DOTs found virtually no incidence of successful lawsuit if the facilities provider followed AASHTO guidelines.
Resource: Legal Aspects of Bikeways, http://tinyurl.com/p8c2cl6
National Academy of Sciences
Resource: Guidebook on Pedestrian and Bicycle Volume Data Collection, National Academies Press, January, 2014, P. xv, https://tinyurl.com/ybdxt88u
