In 2014-15, NYC’s Department of Transportation performed a six month traffic study of bike use across the GWB South path. It was performed in a manner consistent with thirty years of reporting on its East River Bridges and allows for useful comparisons.
- The GWB’s heaviest use is weekends. East River bridges are busiest weekdays.
- The GWB sustained 3700 cyclists per day, making it the #3 most-biked-bridge in NYC on a daily basis – behind the Williamsburg and Manhattan and ahead of the Queensboro and the Brooklyn.
- The GWB was the #1 most-biked in October 2014 with 5112 bike trips per day and again in April 2015 with 4283 daily trips.
 Daily averages for East River Bridges (weekdays) and GWB (weekends). Source NYCDOT.
- Between 2010 and 2015, bike travel across the GWB grew faster than on any East River bridge at 10.4% per year.1 2 3
- If that rate of growth sustains through 2024, daily trips across the GWB will exceed 9000 per day, raising it to #2 most biked, ahead of the Williamsburg.
- The GWB could slip into #1 if proposed improvements to the Brooklyn reduce overflow onto the Manhattan.4
- At 7 foot, the GWB will have by far the narrowest path of the five bridges.
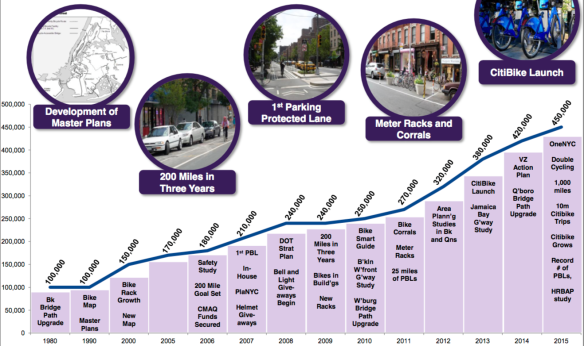
- Daily bike trips across NYC overall rose from 250K in 2010 to 450K in 2015, or at an annual growth rate of 12.5%.
- New York City has 828,000 adult cyclists and no recreational facilities not shared with pedestrians.5
 Data source: NYCDOT, PANYNJ. Widths by Neile Weissman.
- If current use on Walkway Over the Hudson and projections for the path new Tappan Zee hold for the GWB, we should see an influx of pedestrians on the North Path starting in 2020.6 7
[1] “Weekend bike volume across the GWB in 2010 was 2252 cyclists per day.” (Months not specified.) – Port Authority Bicycle Master Plan. p. 7, http://tinyurl.com/zrm26lb.
[2] Annualized growth from 2252 cyclists per day in 2010 to 3699 in 2015 is 10.43%. – moneychimp.com, http://tinyurl.com/4ghj6
[3] “Cyclist Counts At East River Bridge Locations 12-Hour Weekday Counts, 7AM-7PM” NYC Department of Transportation, http://tinyurl.com/janfkso
[4] “Brooklyn Bridge, the ‘Times Square in the Sky,’ May Get an Expansion,” NY Times, http://tinyurl.com/jv8bxfn
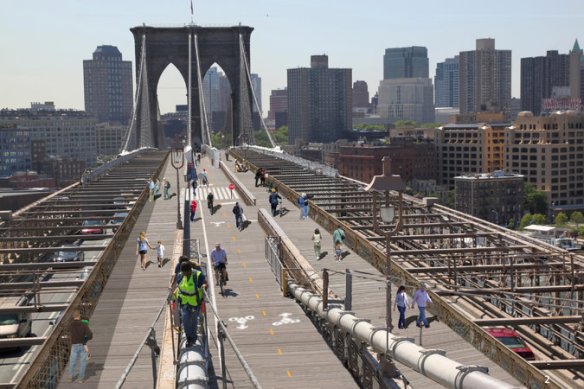
 Proposed expansion of Brooklyn Bridge. Image NYCDOT
[5] “Cycling in the City,” NACTO-NYCDOT p. 11, http://tinyurl.com/ho9gvy5
[6] “nearly 500,000 people visit Walkway State Park annually and nearly half of them coming from outside the region”, Walkway Over the Hudson, https://walkway.org/impact
[7] “By the state Thruway Authority’s own estimates, 473 visitors could visit it per hour during peak times, with 59 percent arriving by car and 19 percent by bike.”, LoHud Journal News, http://tinyurl.com/gr7bkwq
